![]()
Set experiment settings
Follow the appropriate procedure to set the experiment settings of your new project. To create a new project, please refer to First steps.
- Option 1: Simulation-based project
- Option 2: Video-based project
- Option 3: Trajectory-based project
- Option 4: Histogram-based project
<< PREVIOUS: Trajectory-based project
Option 4: Histogram-based project
In this section, experiment settings are set for projects starting with histogram import.
They are specific to each project and include the histogram file structure but also experimental conditions and colors used to plot data.
They are initially set when creating a new histogram-based project by pressing
 in the
Project management area and can be edited by pressing
 in the same area.
Press
 to navigate through the settings and
 to complete the creation of the new project or immediately apply the modifications to the existing project.
Import
Use this tab to import the histogram from a file.
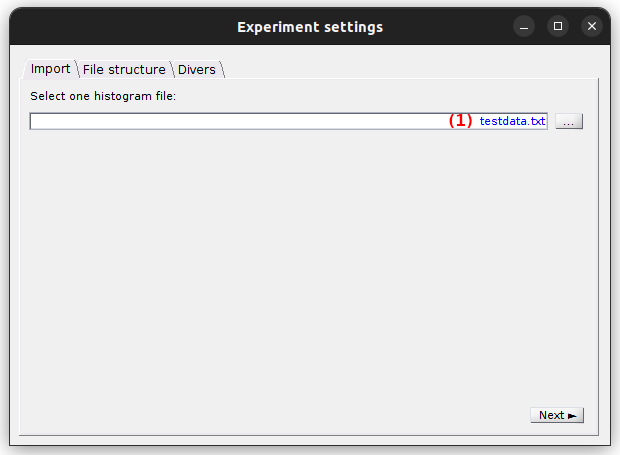
To import an histogram file, press
 and select the file in the browser.
Upon success, the imported histogram file name is shown in (1).
and select the file in the browser.
Upon success, the imported histogram file name is shown in (1).
Only one histogram can be imported from the histogram file. Histogram data are imported for Histogram analysis only, no additional processing/transformation will be performed.
The file structure must contain at least two columns:
- the bin values,
- the histogram counts.
File structure
Use this tab to define the structure of the histogram file.
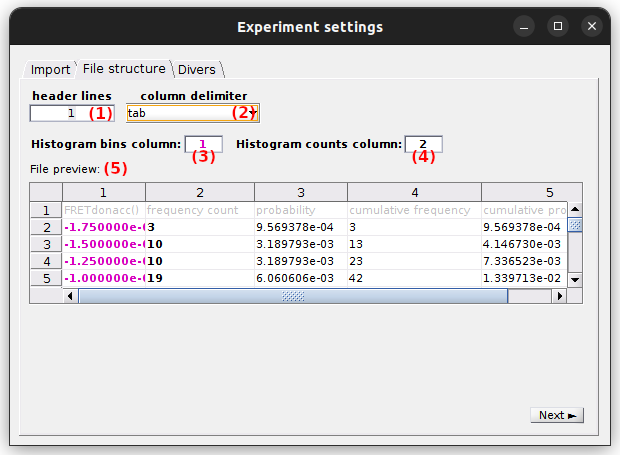
Set parameters parameters (1) to (4) to define the structure of the histogram file. Use the File preview in (5) to verify the proper reading of file columns and histogram data when adjusting parameters.
- (1) Header lines
- (2) Column delimiter
- (3) Histogram bins
- (4) Histogram counts
- (5) File preview
The structure define on the example above is used to import Histogram files containing FRET data.
Header lines
The number of header lines is the number of lines on top of the file that do not contain any histogram data. Header lines are represented with a gray-colored font in the File preview.
Column delimiter
Column delimiters are characters written in the file that separate column data. Supported delimiters are:
blanks (tab,spaces): both tab and space characterstab: tab character (in most ASCII files exported from MASH),: comma character;: semi-column characterspace: space character
You can ensure a proper column separation by using the File preview.
Note : In later versions, the supported file structures will be extended with a custom delimiter and the .json format.
Histogram bins
Define here the file column where histogram bin values are written.
Histogram bins are colored in pink in the File preview to ensure a proper reading of time columns.
Histogram counts
Define here the file column where histogram counts are written.
Histogram counts are colored in black in the File preview to ensure a proper reading of time columns.
File preview
The file preview shows the content of the histogram file using the current define structure. The file content is color-coded, where Header lines are grayed out, Histogram bins are colored in pink, and Histogram counts are colored in black.
It can be used to verify the proper reading of file columns and histogram data when adjusting parameters (1)-(4).
Divers
Use this tab to define the project’s title, optional parameters, the video sampling time and plot colors.
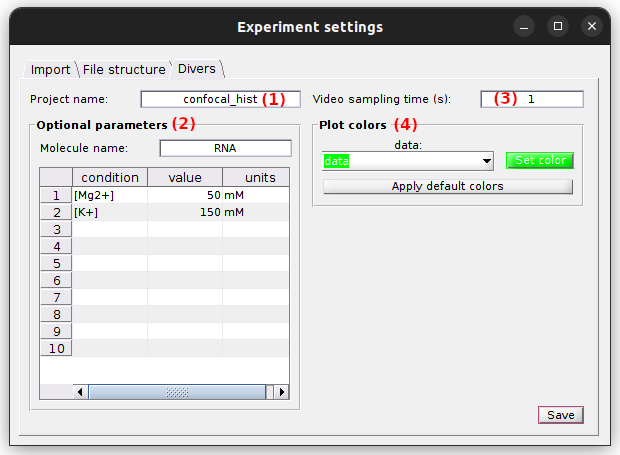
- (1) Project’s title
- (2) Optional parameters
- (3) Video sampling time
- (4) Plot colors
Project’s title
The title is the name appearing in the project list. It is defined in (1). Leaving (1) empty will give the title “Project” to your project.
default: histogram
Optional parameters
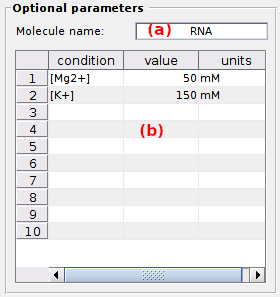
Optional parameters include the name of the investigated molecule, set in (a), and the experimental conditions set in (b).
Experimental conditions can be added, modified and removed by simply editing the condition’s name, value and units in the corresponding column of table (b).
Optional parameters solely act as project “tags” saved with the MASH project file and exported in Processing parameter files.
default: [Mg2+] in mM (magnesium molar concentration) and [K+] in mM (potassium molar concentration).
Video sampling time
The video sampling time is shown in seconds in (3). For histogram-based projects, the sampling time must be set manually and is purely informative.
default: 1 second
Plot colors
Use this panel to define the colors used to plot the histogram.
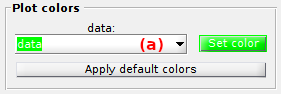
The histogram is named data by default as shown in the list (a).
To set the RGB plot color, press
 to open the color picker.
To use a predefined color, press
 .
.
default: green.