![]()
Set export options
Export options define the particular files to export from module Trace processing.
The window is accessed by pressing
 in the
Control area of module Trace processing.
in the
Control area of module Trace processing.
After modification, press
 to start writing files.
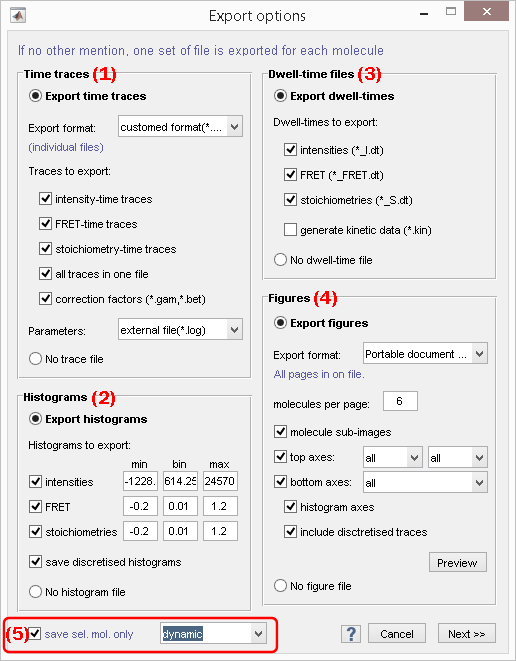
Window components
- Export trajectories and processing parameters
- Export histograms
- Export dwell times
- Export figures
- Molecule status
Export trajectories and processing parameters
Use this panel to export time-traces and processing parameters files in various formats.
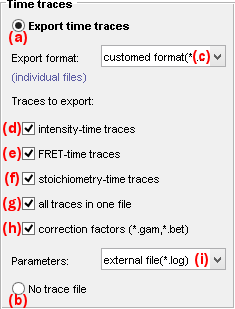
To export time traces and processing parameters activate the option in (a), otherwise activate the option in (b).
Time traces can be exported in the following file formats by selecting the appropriate option in list (c):
customed format (*.txt); see Customed formatHaMMy-compatible (*.dat); see HaMMy trace filesvbFRET-compatible (*.mat); see vbFRET trace filesSMART-compatible (*.traces); see SMART trace filesQUB-compatible (*.txt); see QUB trace filesebFRET-compatible (*.dat); see ebFRET trace filesAll formatsto export all file formats sub mentioned
Gamma and beta correction factors can be collected for all molecules and exported to separated *.gam and *.bet file respectively by activating the option in (h); see Gamma factor file and Beta factor file for more information about the file structures.
Processing parameters can be exported in different ways by selecting the appropriate option in list (i):
- in file headers with the customed format by selecting
ASCII file headers, - to individual files by selecting
external file(*.log); see Processing parameters file for more information about the file structure.
To ignore processing parameters select none in list (i).
Customed format
The content of these trace files is customizable and can include:
- intensity-time traces by activating the option in (d)
- FRET-time traces by activating the option in (e)
- stoichiometry-time traces by activating the option in (f)
- trace processing parameters by activating the option in (i)
Specific data-time traces can be exported to one common ASCII file per molecule or to individual ASCII files, by respectively activating or deactivating the option in (g).
See Processed trace files for more information about the file structure.
Export histograms
Use this panel to export histogram files.
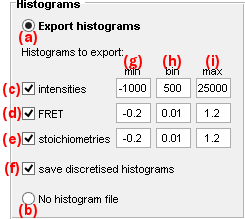
Export histograms by activating the option in (a), otherwise activate the option in (b).
Trace-specific histograms can be exported to individual .hist files for the following data:
- intensity by activating the option in (c)
- FRET by activating the option in (d)
- stoichiometry by activating the option in (e)
Histogram binning is defined by the histogram bounds set in (g) and (i) and the bin size set in (h).
If desired, histograms of states trajectories can also be exported to individual files by activating the option in (f).
Export dwell times
Use this panel to export dwell-times and statistics on dwell-times to files.
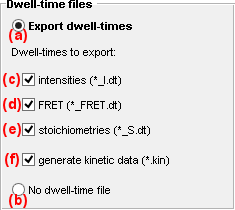
Dwell times are the durations of each state in state trajectories. Dwell time files are specific to a state trajectory and list the state durations in chronological order.
Export dwell times and/or statistics on dwell times by activating the option in (a), otherwise activate the option in (b).
Trace-specific dwell times can be exported to individual .dt files for the following data:
- intensity by activating the option in (c)
- FRET by activating the option in (d)
- stoichiometry by activating the option in (e)
If desired, data-specific statistics on dwell times can also be exported to one common file by activating the option in (f); see Dwell time statistics files for more information about the content of these files.
Export figures
Use this panel to export figure files.
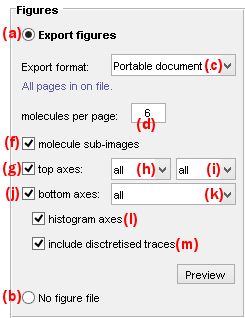
Figure files contain graphics representing individual time traces, histograms, and/or single molecule images as shown in the Visualization area of Trace processing.
Export figures by activating the option in (a), otherwise activate the option in (b).
Figures can be exported in the following file formats by selecting the appropriate option in list (c):
Portable Document format(*.pdf)(PDF)Portable network graphics(*.png)(PNG)Joint Photographic Experts Group(*.jpeg)(JPEG)
For format PDF, pages are exported to one single file, whereas for other formats, pages are exported to individual files by appending the file name with the corresponding molecule indexes.
The number of molecules per figure page is set in (d).
The content of figure files is customizable and can include:
- sub-images of molecules, by activating the option (f)
- intensity-time traces of emitters selected in list (h) and upon illumination selected in list (i), by activating the option (g)
- intensity ratio-time traces selected in list (h), by activating the option (j)
If desired, histograms and/or state trajectories can also be included by activating the respective options in (l) and/or (m).
The resulting figure can be previewed by pressing
 .
.
PDF export uses the MATLAB script append_pdfs developed by Oliver Woodford that can be found in the
MATLAB exchange platform.
Note: Exporting PDF figures requires the installation of Ghostscript that can be downloaded here
Molecule status
Defines the status of the molecule sample to export.

To only export the molecules that are selected in the Molecule list, activate the box in (a).
To export a sub-group of molecules, select the proper tag in list (b), otherwise, select All molecules to export all molecules.