![]()
Denoising
Denoising is the sixth panel of module Trace processing.
Access the panel content by pressing
 .
The panel closes automatically after other panels open or after pressing
.
The panel closes automatically after other panels open or after pressing
 .
.
Denoising settings are specific to each molecule.
Press
 to apply current settings to all molecules.
Corrections will be applied only after processing data by pressing
to apply current settings to all molecules.
Corrections will be applied only after processing data by pressing
 ; see
Process all molecules data for more information.
; see
Process all molecules data for more information.
Use this panel to reduce artificially the noise amplitude in time traces.
Panel components
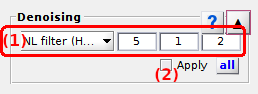
Denoising settings
Use this interface to define a denoising method.
Denoising applies to intensity-time traces. Intensity ratio-time traces are recalculated from smoothed intensity trajectories.
Three denoising methods are available and are described in the following sections:
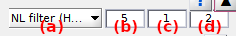
Select the denoising method in menu (a) and set the corresponding parameters in (b-d). Method parametrizations are described in details in the table below.
| method | parametrization | default parameters |
|---|---|---|
Sliding average |
(b): frame window size used for average | (b)=3 |
NL filter (Haran)1 |
(b): exponent for weight enhancement, (c): frame range for variance calculations, (d):length factor used for causal and anti-causal mean calculations | (b)=5, (c)=1, (d)=2 |
Wavelet (Taylor)2 |
(b): thresholding strength, (c): threshold calculation for each decomposition level (1) or constant thresholds (2) , (d): single (1) or iterative (2) denoising process | (b)=3, (c)=2, (d)=1 |
The MATLAB scripts for method NL fitler (Haran) was generously provided by Dr Stefan Krause from the Institute of Physics, Chemnitz University of Technology.
The MATLAB scripts for method Wavelet (Taylor) was downloaded from
LandesLab Github repository.
Sliding average
Each intensity data point is recalculated as the average value over a frame window composed of (b) frames and centered on the data point.
NL filter (Haran)
This algorithm performs the non-linear filtering procedure of Chung and Kennedy on donor and acceptor time traces. It smooths intensity-time traces of a FRET pair and emphasizes synchronized jumps in donor and acceptor intensity-time traces that are considered as FRET transitions.
In a first place, the causal and anti-causal means, Iˉt-r(t) and Iˉt+r(t) respectively, are calculated for each data point t of the intensity-time trace I(t) such as:
and over four different frame ranges r, such as:

with P1 the parameter set in (b).
Then, for each data point t is assigned a causal and an anti-causal weight, wt-r(t) and wt+r(t) respectively, that are inversely related to the corresponding variances, σt-r2(t) and σt+r2(t), such as:
with P3 the parameter set in (d), which emphasizes the differences between low- and high-weight data.
Causal and anti-causal variances represents the gap between the means and the experimental intensity: the higher the gap, the most probable a transition. Variances are calculated over a fixed frame range P2 such as:
with P2 the parameter set in (c) that represent the delay necessary for a transition to fully start and end.
Finally, smoothed intensities Idenoise(t) are calculated as the weighted sum of the causal and anti-causal mean intensities over all r ranges, and normalized by the sum of donor and acceptor causal and anti-causal weights. For instance, smoothed acceptor intensity is calculated such as:
Wavelet (Taylor)
The script first runs the Haar-wavelet decomposition on intensity-time traces and on several levels. Thresholding is then performed on Haar coefficient according to three different strengths:
- firm thresholding: (b) = 1
- hard thresholding: (b) = 2
- soft thresholding: (b) = 3
Thresholds can either be calculated for each decomposition level by setting (c) = 1, or set constant by setting (c) = 2. Denoised intensity-time traces are obtained by inversion of the wavelet transformation.
Denoising can either be performed in one simple process by setting (d) = 1, or by several iterative processes including time-shifting by setting (d) = 2. In the latter case, the final trace is averaged over the different process iterations.
Note: The use of hard thresholding can be relatively time consuming and requires a bit of patience.
References
- G. Haran, Noise reduction in single-molecule fluorescence trajectories of folding proteins, Chem. Physics 2004, DOI: 10.1016/j.chemphys.2004.05.017
- J.N. Taylor, D.E. Makarov, C.F. Landes, Denoising Single-Molecule FRET Trajectories with Wavelets and Bayesian Inference, Biophysical J. 2010, DOI: 10.1016/j.bpj.2009.09.047
Apply denoising
Activate or deactivate this option to smooth or visualize the original intensity-time trace respectively.
For more information about the use of denoising in smFRET data analysis, see Smooth trajectories in Trace processing workflow.