![]()
Use Trace manager
The trace manager gives an overview of all single molecules in the project and allows to assemble a molecule selection as well as to give molecules specific tags.
It is accessed by pressing
 in the
Sample management panel of module Trace processing.
in the
Sample management panel of module Trace processing.
Trace manager is used to sort molecules into sub-groups and/or exclude irrelevant traces from the set. It is composed of three modules:
Overview Automatic sorting Video view
Overview
Overview is used to browse individual molecules and assemble a molecule selection.
The final molecule selection is exported to module Trace processing by pressing
 .
.
Overview is divided into two panels (1-2).
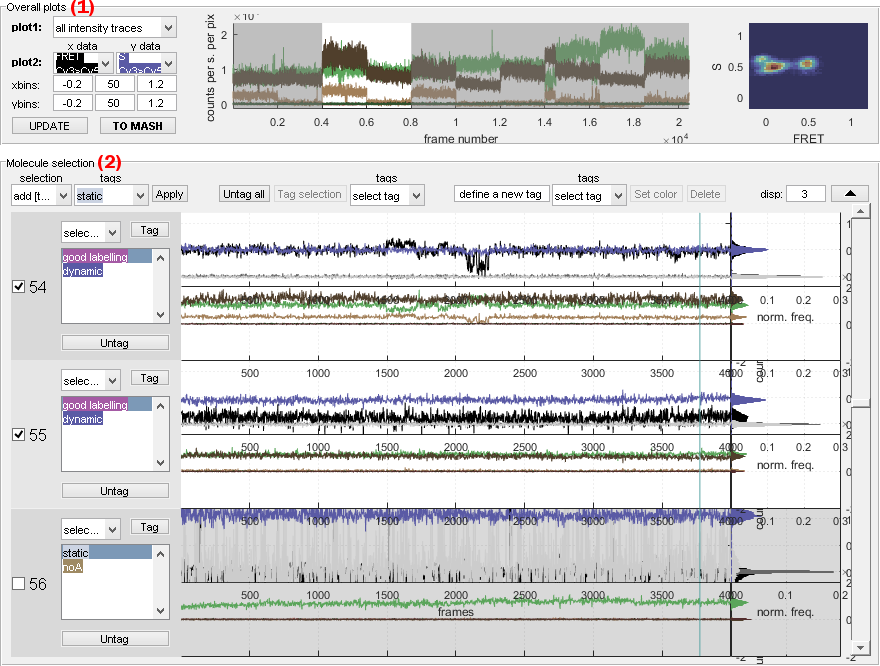
Interface components
Overall plots
Use this interface to identify outliers in the molecule selection by controlling irregularities in data distributions.
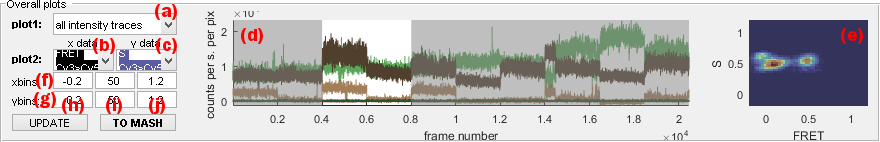
Overall plots show the following cumulated data plots for the molecule selection assembled in panel Molecule selection:
- Concatenated traces shown in axes (c)
- Histograms shown in axes (d)
Data plots must be updated after modification of the molecule selection by pressing
 .
.
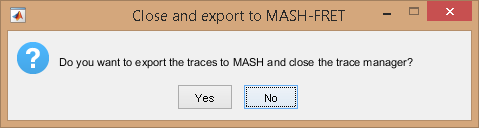
The final molecule selection is exported to module Trace processing by pressing
; as the operation can not be reversed, a warning pops up.
Concatenated traces
Concatenated time traces of selected molecules allow to identify outliers.
For instance, intensity-time traces with abnormally high or low intensities are easily visible and are good candidates for exclusion from the set.
Data available for concatenated trace plot are listed in menu (a) and include:
[E] at [W]nmfor intensity-time traces, with[E]the emitter and[W]the laser wavelengthtotal [E] (at [W]nm)for intensity-time traces of emitter[E]in absence of any acceptor and upon emitter-specific excitation wavelength[W]FRET [D]>[A]for FRET-time traces, with[D]and[A]the donor and acceptor emitters respectivelyS [D]>[A]for stoichiometry data associated to the FRET pair where[D]and[A]are the donor and acceptor emitters respectively
Selected molecules that are in view in panel Molecule selection are highlighted with a white background, whereas excluded or out-of-view molecules are covered with a transparent black mask.
Individual molecules can be accessed and shown in Molecule selection by simply clicking on the corresponding portion of the concatenated time trace.
Histograms
Overall 1D- or 2D-data histograms are used to identify different sub-populations in the sample and to control the homogeneity of data distribution.
For instance, the presence of single labelled species is easily identified by peaks centered on 0 and 1 in the overall stoichiometry histogram and indicates the need for further sample refinement.
For 1D histogram plot, menu (c) must be set to none and menu (b) to one of the following data to histogram:
[E] at [W]nmfor intensity histogramstotal [E] (at [W]nm)for intensity histograms in absence of any acceptorFRET [D]>[A]for FRET histogramsS [D]>[A]for stoichiometry data associated to the FRET pair where[D]and[A]are the donor and acceptor emitters respectively
For 2D histogram plot, menu (b) and (c) must be set to data to plot in the x- and y-dimension respectively.
Data are sorted into bins defined in columns (h) (lowest limit), (i) (number of binning intervals) and (j) (highest limit) and in row (f) or (g) for the x- or y-axis respectively,.
2D histograms are built with the MATLAB script hist2 developed by Tudor Dima that can be found in the
MATLAB exchange platform.
Molecule selection
Use this interface to assemble or review the molecule selection.
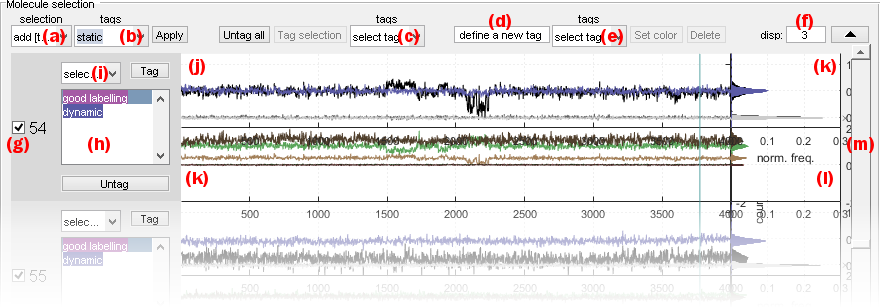
Panel Molecule selection shows individual data plots defined by Plot for individual molecules that can be browsed using the sliding bar in (m).
The interface can be optimized by adjusting the number of molecules per page in (f), and hiding the panel
Overall plot by pressing
 .
.
Intensity-time traces and histograms are respectively shown in axes (j) and (k), whereas FRET- and stoichiometry-time traces and histograms are respectively shown in axes (k) and (l).
Individual single molecule data are inspected one by one to define their status, which includes:
For instance, single molecules with incoherent intensity-time traces can be excluded from the selection and static FRET traces can be affiliated to the static subgroup.
Overall plots must be updated after finishing modifications in
Sample exclusion by pressing
.
Sample exclusion
Selection or exclusion of individual molecules is done by activating/deactivating the option in (e).
To help with sample selection, groups of molecules can be selected/unselected at the same time using the list of criteria in menu (a). Selection criteria are:
current: uses the current selection (default)all: selects all moleculesnone: exclude all moleculesinverse: select excluded molecules and exclude selected molecules in the current selectionadd [Tag]: add molecules affiliated to subgroup selected in menu (b) to the current selectionadd not [Tag]: add molecules that are not affiliated to subgroup selected in menu (b) to the current selectionremove [Tag]: remove molecules affiliated to subgroup selected in menu (b) from the current selectionremove not [Tag]: remove molecules that are not affiliated to subgroup selected in menu (b) from the current selection
Press
 to refine the molecule selection according to these settings.
Subgroup affiliation
Subgroup affiliations (tags) are listed in (e).
Create a new tag by typing the new tag name in (d), and pressing
 to modify the associated color (can be modified any time).
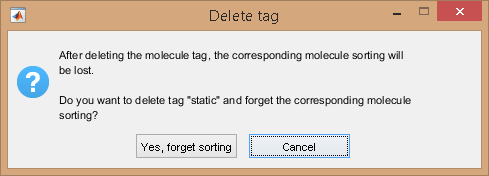
Delete a tag by selecting the tag in menu (e) and pressing
 ; as the operation can not be reversed, a confirmation warning pops up if some molecules are affiliated to the corresponding subgroup.
Tags of individual molecules are listed in (h).
Tag individual molecules by selecting a tag in menu (i) and pressing
 .
.
Remove tag from individual molecules by selecting a tag in menu (i) and pressing
 .
.
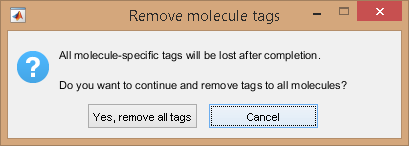
Remove tag from all molecules at once by pressing
 .
In this case, all molecule tag listed in (h) will be irreversibly cleared.
As the operation can not be reversed, a confirmation warning pops up.
.
In this case, all molecule tag listed in (h) will be irreversibly cleared.
As the operation can not be reversed, a confirmation warning pops up.
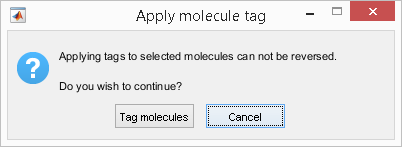
Tag molecules included in selection all at the same time by selecting the desired tag in menu (c) and pressing
 .
As the operation can not be reversed, a confirmation warning pops up.
.
As the operation can not be reversed, a confirmation warning pops up.
Perform more advanced molecule tagging by defining groups of molecules using specific data criteria with the tool Automatic sorting. To identify molecule subgroups in the video, molecule tags can be visualized on the average video image with tool with the tool Video view.