![]()
Transition analysis bootstrap plots
Transition analysis bootstrap plots files are PDF files with the extension .pdf. They are usually found in the main/transition_analysis/kinetics folder.
Table of contents
Description
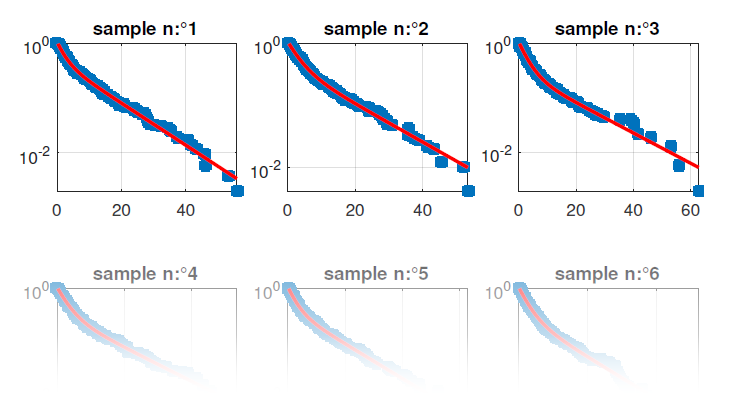
Transition analysis bootstrap plots files are dwell-time-histogram-specific and show the bootstrap sample histograms with the associated exponential fit.
They are created in the /transition_analysis/kinetics analysis sub-folder after performing an bootstrap exponential fit on dwell time histograms and exporting results from the
Project management area of module Transition analysis.
File name
The file is named by the user during the export process.
By default, the file is named after the selected project file and is appended with the extension _[Ddd]_[j]to[j'], where [Ddd] is the data type written in the file and [j] and [j'] are the respective x- and y- coordinates of the transition cluster.
Data types supported in dwell time fit files are:
I[i]-[L]: intensities in detection channel indexed[i]upon illumination with laser wavelength[L]nmFRET[D]to[A]: FRET from donor emitter detected in channel indexed[D]to acceptor emitter detected in channel indexed[A]S[D]to[A]: stoichiometry associated to donor emitter detected in channel indexed[D]and acceptor emitter detected in channel indexed[A]
The extension _[Ttt] is added to the data type [Ddd] if a particular subgroup of molecules is analyzed, with [Ttt] the corresponding molecule tag.
Structure
Transition analysis bootstrap plots files contain plots of the bootstrap histogram samples and associated exponential fit. The fitting function is plotted in solid red line, such as: