![]()
Plot
Plot is the first panel of module Video processing.
Access the panel content by pressing
 .
The panel closes automatically after other panels open or after pressing
.
The panel closes automatically after other panels open or after pressing
 .
.
Use this panel to set the appearance and pixel intensity units in the Visualization area.
Panel components
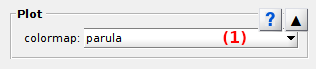
Color map
Use this list to define the color palette used to display pixel intensities.
The list contains the standard color maps of MATLAB:
| name | palette |
|---|---|
parula |
 |
turbo |
 |
hsv |
 |
hot |
 |
cool |
 |
spring |
 |
summer |
 |
autumn |
 |
winter |
 |
gray |
 |
bone |
 |
copper |
 |
pink |
 |
jet |
 |
lines |
 |
colorcube |
 |
prism |
 |
flag |
 |
white |
 |
default: turbo