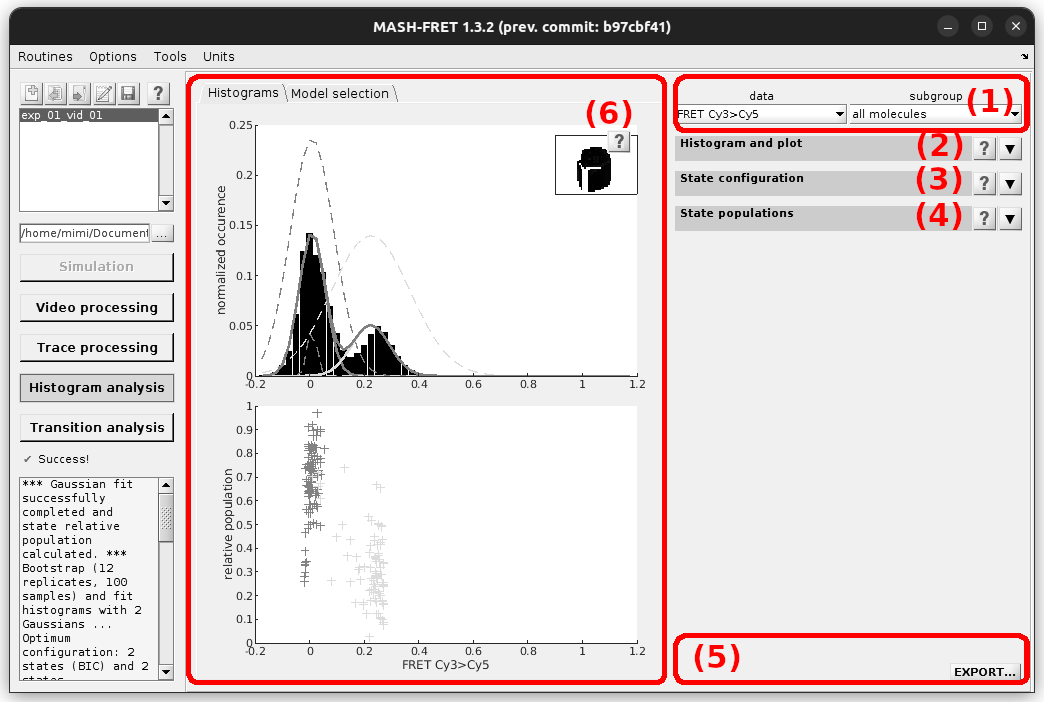
Histogram analysis is composed of one data selection area (1), three panels (2-4), one control area (5) and one visualization area (6).
To learn about individual components, please refer to the corresponding content: