Plot
Plot is the second panel of Trace processing.
Access the panel content by pressing
 .
The panel closes automatically after other panels open or after pressing
 .
.
Use this panel to define which time traces to plot in the Visualization area.
Panel components
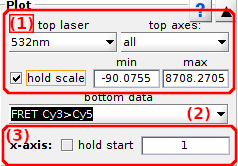
Plot in top axes
Use these menus to define the intensity data to plot in Intensity-time traces and histograms.
To plot intensity data upon illumination of a particular laser, select the corresponding wavelength in menu (a), or select the option all to plot intensities upon all laser illuminations.
To plot intensity data of a particular emitter, select the corresponding detection channel in menu (b), or select the option all to plot all emitter intensities.
The upper and lower limits of the intensity axis can be set to constant values by activating the option in (c) and setting the limits in (d) and (e). Intensity units are defined in menu Units>intensities of the
menu bar.
Plot in bottom axes
Use this menu to define the intensity ratios to plot in Ratio-time traces and histograms.
To plot the FRET data of a particular donor-acceptor pair, or the stoichiometry-time trace of a particular emitter, select the corresponding data in the list.
To plot only FRET data of all donor-acceptor pairs, select the option all FRET in the list.
To plot only stoichiometry data of all emitters, select the option all S in the list.
To plot intensity ratio data, select the option all.
Time axis
Use this interface to define the time axis of time-traces.
If needed, the begining of intensity-time traces can be ignored by setting the new starting point in (a). To keep the starting point fixed for all single molecules, activate the option in (b).
The starting point is given in time units defined in the menu Units of the
menu bar.
For a better visualization, the time axis of trajectories can be rescaled using the new starting point and the photobleaching cutoff as an ending point by activating the option in (c).


