![]()
Workflow
In this section you will learn how to determine the most sufficient state configuration from histograms, to obtain the relative state populations and to estimate the associated cross-sample variability.
Initial data are the trajectories from Trace processing’s output.
The procedure includes four steps:
- Import histogram
- Build histogram
- Determine the most sufficient state configuration
- Estimate state populations and associated cross-sample variability
- Export data
Import histogram
Initial histograms come from Trace processing’s output for simulation-, video-, and trajectory-based projects, or from an external ASCII file.
In the three first cases, you can skip this step and go directly to the next one.
In the latter case, a new histogram-based project must be created. This implies to import the histogram file and define the data structure in the file. After the project creation is completed, it is recommended to save it to a .mash file that should regularly be overwritten in order to keep traceability and access to the results.
To create a new histogram-based project:
-
Open the experiment settings window by pressing
 in the
project management area and selecting
in the
project management area and selecting import histogram. -
Import the histogram file and define your experiment setup by configuring tabs:
If necessary, modify settings in Divers any time after project creation.
-
Define how data are structured in the file by configuring tab File structure.
-
Finalize the creation of your project by pressing
 ; the experiment settings window now closes and the interface switches to module Histogram analysis.
 -
Save modifications to a .mash file by pressing
 in the
project management area.
in the
project management area.
Notes: Only one histogram can be imported in a histogram-based project. Beside, histogram-based projects only have access to the module Histogram analysis.
Build histogram
To build an histogram, data are limited to specific boundaries and sorted into bins of specific size. Ideally, each state population appears as a Gaussian-shaped peak in the histogram.
The bin size has a substantial influence on the histogram shape: large bins will increase the overlap between neighbouring peaks until the extreme case where all peaks are merged in one, whereas short bins will flatten the peaks until the extreme case where no peak is distinguishable.
Histogram boundaries are important as they define the range of data considered for analysis. Large data ranges can include outliers that would bias the state analysis and narrow ranges can exclude relevant contribution for population analysis.
The histogram limits and bin size have to be carefully chosen in order to enhance the natural shape of data distribution without altering it.

To build the histogram:
-
Select the data and molecule subgroup to analyze in the Data list and Molecule subgroup list, respectively
-
Set parameters:
Histogram binning
Overflow binsThe histogram is instantly built with the new parameters and displayed in the Visualization area
Determine the most sufficient state configuration
In histogram analysis, states are identified as histogram peaks that are ideally modelled by a Gaussian distribution. Therefore, the overall histogram can be described by the sum of J Gaussian distributions, with J the number of states.
In the case of well-separated peaks, J is easily determined by eye, but most of the time, the histogram peaks overlap each other and can’t be accurately distinguished.

One way of objectively identifying the number of overlapping peaks in a histogram is to, first, find the Gaussian mixtures that describe the data the best for different J, and then to compare optimum models with each other. As the goodness of fit, or model likelihood, fundamentally increases with the number of components, inferred models can be compared via:
- the improvement in goodness of fit
- the Bayesian information criterion (BIC)
In the first case, a certain improvement in model likelihood is expected when adding a new component to the model, e. g. an increase of 20%. Here, the most sufficient model is the least complex model for which adding a component does not fulfil this requirement.
In the second case, the BIC is used to rank models according to their sufficiency, with the most sufficient model having the lowest BIC.
To determine the most sufficient state configuration:
-
If not already done, select the data and molecule subgroup to analyze in the Data list and Molecule subgroup list, respectively
-
Set parameters:
-
Start inference of state configurations by pressing
 ; after completion, the display is instantly updated with the most sufficient Gaussian mixture
Estimate state populations and associated cross-sample variability
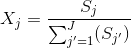
The relative population Xj of a state j is associated to the probability of finding a molecule in state j any time in the sample.
It can be estimated from the histogram by integrating each peak to a value Sj and calculating the ratio:
For well-separated histogram peaks, Sj values are calculated using thresholds between peaks. For overlapping peaks, a mixture of J Gaussians is fitted to the histogram and Gaussian integrals are used as Sj values.

The outcome of such analysis are single estimates of relative state populations, meaning that they carry no information about the variability across the molecule sample.
One way to evaluate the cross-sample variability of relative state populations is to use the bootstrap-based analysis called BOBA-FRET. BOBA-FRET applies to both threshold and Gaussian-fitting methods, and infers the bootstrap mean μX,j and bootstrap standard deviation σX,j of state populations for the given sample.

To calculate relative state populations:
-
If not already done, select the data and molecule subgroup to analyze in the Data list and Molecule subgroup list, respectively
-
Set parameters in Method settings
-
Import parameters of one of the inferred state configurations by selecting the configuration in Inferred models and pressing

-
Adjust parameters in Thresholding or Gaussian fitting and respectively press
 or
or
 to calculate state relative populations
Export data
Histograms, analysis results and analysis parameters can be exported to ASCII files and PDF figures; see Remarks for more information.
To export data to files:
-
If not already done, select the data and molecule subgroup to export in the Data list and Molecule subgroup list, respectively
-
Press
 and select the desired destination to start writing files.
Remarks
The type of exported files depends on which analysis was carried on; see Export analysis results for more information.