Predicting FRET#
This tutorial demonstrates how to perform an in silico FRET experiment using the external package FRETtraj on the basis of an MD simulation with explicit fluorophores attached via FRETlabel.
Extraction of \(R(t)\) and \(\kappa ^2(t)\)#
Built-in GROMACS tools can be used to extract the interdye-distance \(R_\text{DA}\) and the orientation factor \(\kappa ^2\).
First, define the dipole vector by an atom pair for each of the two dyes. You may either select the atoms based on their indices with gmx make_ndx or more expressively by reading in an atom selection with gmx select. To this end, save the following to a text file named dye_selection.txt (here atom names C2 and C14 define the dipole vector of the dye residues C3W and C5W)
"Cy3_C2C14" resname C3W and (name C2 or name C14)
"Cy5_C2C14" resname C5W and (name C2 or name C14)
Then run gmx select on a reference pdb file to get a new index file called dyes.ndx
gmx select -s DNA.pdb -on dyes.ndx < dye_selection.txt
Now, extract \(R_{DA}\) and \(\kappa ^2\) using gmx dyecoupl (Hoefling et al., Comput. Phys. Commun. 2013 [2]) which is built into GROMACS.
gmx dyecoupl -f DNA.xtc -n dyes.ndx -o DNA_rkappa.dat
To calculate anisotropy decays also extract the coordinates of the atoms defining the dipole vector
gmx traj -f DNA.xtc -s DNA.pdb -n dyes.ndx -ox DNA_donor_coords.xvg
gmx traj -f DNA.xtc -s DNA.pdb -n dyes.ndx -ox DNA_acceptor_coords.xvg
Simulating photons with FRETraj#
import fretraj as ft
import numpy as np
import matplotlib.pyplot as plt
import seaborn as sns
import lmfit
The parameter file DNA_parameters.json defines bursts settings, the experimental inputs (fluorescence lifetime, quantum yields) and the file paths.
parameters = ft.burst.readParameters('../data/DNA_parameters.json')
Next, initialize a new experiment including calculation of the time-resolved anisotropy
experiment = ft.burst.Experiment('../data', parameters, compute_anisotropy=True)
Loading files...
Orientation independent R0_const = 5.8 A

              donor    acceptor
QY            0.20    0.30
tau (ns)      0.75    1.50
k_f (ns^-1)   0.27    0.20
k_ic (ns^-1)  1.07    0.47

Burst averaging method: all
Calculate anisotropy: yes
Combining burst...
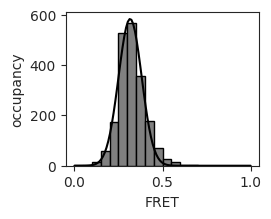
average FRET efficiency: 0.32 +- 0.08
Plot the FRET distribution and fit a normal distribution to the data.
hist, bins = np.histogram(experiment.FRETefficiencies, bins=20, range=(0,1))
bincenters = binMid = (bins[1:]+bins[:-1])/2
model = lmfit.models.GaussianModel()
pars = model.guess(hist, x=bincenters)
out = model.fit(hist, pars, x=bincenters)
x_fit = np.linspace(0,1,100)
y_fit = model.func(x_fit, *list(out.params.valuesdict().values())[:3])
with sns.axes_style('ticks'):
    f, ax = plt.subplots(nrows=1, ncols=1, figsize=(2.5, 2), sharex=False, sharey=False, squeeze=False)
    plt.hist(experiment.FRETefficiencies,bins=20, range=(0,1), color='grey', edgecolor='black')
    plt.plot(x_fit, y_fit, color='k')
    ax[0,0].set_xlabel('FRET')
    ax[0,0].set_ylabel('occupancy')
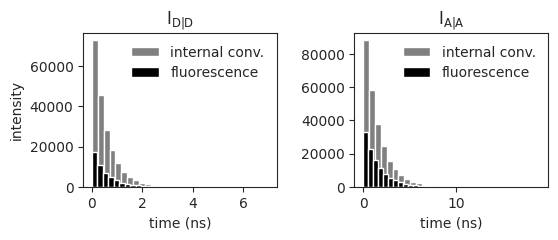
Plot the decay times of the fluorescence emission and internal conversion for donor electrons after donor excitation and acceptor electrons upon acceptor excitation
with sns.axes_style('ticks'):
    f, ax = plt.subplots(nrows=1, ncols=2, figsize=(6, 2), sharex=False, sharey=False, squeeze=False, gridspec_kw={'wspace':0.4})
    ax[0,0].hist(experiment.decaytimes_DD_DA['D_ic'], bins=30, color='grey')
    ax[0,0].hist(experiment.decaytimes_DD_DA['D_f'], bins=30, color='black')
    ax[0,1].hist(experiment.decaytimes_AA['A_ic'], bins=30, color='grey')
    ax[0,1].hist(experiment.decaytimes_AA['A_f'], bins=30, color='black')

    ax[0,0].legend(['internal conv.', 'fluorescence'], frameon=False)
    ax[0,1].legend(['internal conv.', 'fluorescence'], frameon=False)
    ax[0,0].set_title('$\mathregular{I_{D|D}}$')
    ax[0,1].set_title('$\mathregular{I_{A|A}}$')
    ax[0,0].set_ylabel('intensity')
    ax[0,0].set_xlabel('time (ns)')
    ax[0,1].set_xlabel('time (ns)')
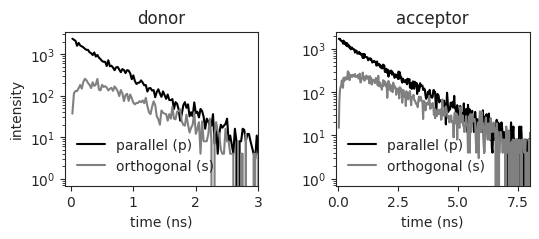
Plot the polarization resolved fluorescence decay of the donor and the acceptor
with sns.axes_style('ticks'):
    f, ax = plt.subplots(nrows=1, ncols=2, figsize=(6, 2), sharex=False, sharey=False, squeeze=False, gridspec_kw={'wspace':0.4})
    ax[0,0].semilogy(experiment.polIntensity['D_f'][:,0], experiment.polIntensity['D_f'][:,1], color='k')
    ax[0,0].semilogy(experiment.polIntensity['D_f'][:,0], experiment.polIntensity['D_f'][:,2], color='grey')
    ax[0,1].semilogy(experiment.polIntensity['A_f'][:,0], experiment.polIntensity['A_f'][:,1], color='k')
    ax[0,1].semilogy(experiment.polIntensity['A_f'][:,0], experiment.polIntensity['A_f'][:,2], color='grey')

    ax[0,0].legend(['parallel (p)', 'orthogonal (s)'], frameon=False)
    ax[0,1].legend(['parallel (p)', 'orthogonal (s)'], frameon=False)
    ax[0,0].set_title('donor')
    ax[0,1].set_title('acceptor')
    ax[0,0].set_ylabel('intensity')
    ax[0,0].set_xlabel('time (ns)')
    ax[0,1].set_xlabel('time (ns)')
    ax[0,0].set_xlim(-0.1,3)
    ax[0,1].set_xlim(-0.1,8)
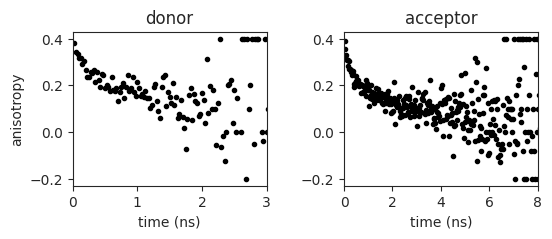
Plot the anisotropy decay of the donor and acceptor fluorophore
with sns.axes_style('ticks'):
    f, ax = plt.subplots(nrows=1, ncols=2, figsize=(6, 2), sharex=False, sharey=False, squeeze=False, gridspec_kw={'wspace':0.4})
    ax[0,0].plot(experiment.anisotropy['D_f'][:,0], experiment.anisotropy['D_f'][:,1], '.', color='k')
    ax[0,1].plot(experiment.anisotropy['A_f'][:,0], experiment.anisotropy['A_f'][:,1], '.', color='k')
    ax[0,0].set_ylabel('anisotropy')
    ax[0,0].set_xlabel('time (ns)')
    ax[0,1].set_xlabel('time (ns)')
    ax[0,0].set_title('donor')
    ax[0,1].set_title('acceptor')
    ax[0,0].set_xlim(0,3)
    ax[0,1].set_xlim(0,8)
