Tutorial PAMtools
[1]:
import importlib
import numpy as np
import pandas as pd
import pamtools.pypam as pp
import matplotlib.pyplot as plt
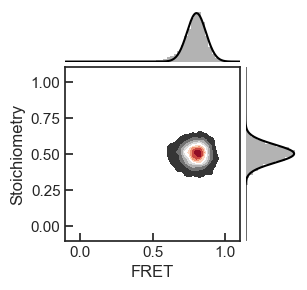
Extract 2D histogram
[4]:
h = pp.pamplot.Hist2d.fromfile('data/hist2d.json')
[5]:
h.fit_histogram(0, [0.8],[0.1])
h.fit_histogram(1, [0.8],[0.1])
[6]:
h.plot2Dhist(style='contour', imgOffset=0, PAMtools_fit=True)
Export FCS fit results
[9]:
fcs = pp.pamplot.FCS.fromfile('data/fcs.txt')
[10]:
fcs.plotFCS(time_limits=[5*10**-7, 0.1], normalization='G0')
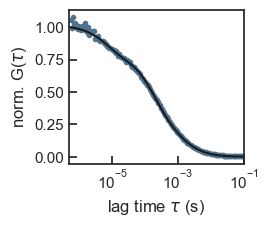
[11]:
fcs.parameters
[11]:
N                0.258003
D               44.769663
w_xy             0.313000
w_z              1.745000
tau_t            6.794145
A_t              0.202325
tau_t2         194.279258
A_t2             0.344981
y0               0.000000
c_nM             0.450065
Rh(298K)_nm      5.478213
Name: 0, dtype: float64
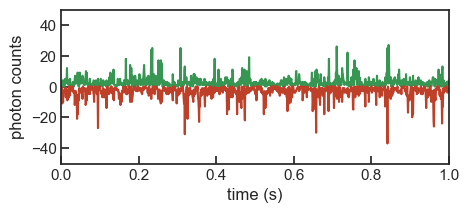
Extract timetrace
[12]:
trace = pp.pamplot.Timetrace.fromfiles('data/timetrace_GG.json', 'data/timetrace_GR.json')
[13]:
trace.plotTrace(time_limits=[0,1])
[ ]: